Introduction
As part of my daily reverse engineering and peering into Windows Internals, I started noticing a strange effect in Windows 8.1 whenever looking at the reference counts of various objects with tools such as WinDBG, Process Explorer, and Process Hacker: seemingly gigantic values on x64 Windows, and smaller, yet still incredibly large values on x86.
For the uninitiated, reference counts (internally called pointer counts), and their cousin handle counts, are the Windows kernel’s way of keeping track of open instances to a certain object (such as a file, registry key, or mutex) in order to implement automatic cleanup and garbage collection. Windows system tools such as Process Explorer or Process Hacker often have handy interfaces for looking at the objects to which a process currently has references to, by analyzing the process handle table.
Looking at Opened Handles and their Properties
In the screenshot below, you can see me looking at the first few handles of the Windows shell, Explorer.exe. Particularly, I am interested in the “DBWinMutex” mutex, at handle 0x44.

What this mutex does is gate access to Windows’ debug buffer, used by the OutputDebugString API, so it’s likely that you’ll see it used in many other processes as well. Since Explorer has at least one component using that API, it has a handle opened to it. Let’s go find out how many other components have a handle to it, by double-clicking and looking at its properties.

Pretty striking, isn’t it? While the handle count, which keeps track of actual handles to the object (implying that (Zw)OpenEvent was used to obtain the reference) is 14 and makes sense given the large number of processes that use the debug buffer to print various trace messages, the reference count, which is meant to include those handles plus any other additional internal kernel component references (which can bypass handles altogether and use the ObReferenceObject family of APIs to safely reference an object), is actually 491351! While it’s technically possible for such a large number of kernel references to exist to the object, it’s highly unlikely, and if one checks the reference counts on other objects, similarly large numbers appear. What’s going on?
Using the Windows Debugger to Dump Object Information
First, let’s make sure this isn’t a bug in Process Explorer. Such tools that peer into undocumented structures are often risk prone to subtle changes in the kernel, so I like to use the Windows Kernel Debugger (WinDBG) to validate what user-mode tools are showing. After all, the debugger dumps the raw memory of the object, which is the ground truth. As you can see below, we can use the handy !object extension to go find the object.

32767 Shades of Reference Bias
As you can see, we’re not really getting anywhere here – WinDBG shows an equally large value (458,584) although it’s not quite the same as Process Explorer’s. In fact, it’s exactly:
491351 – 458584 = 32767 (0x7FFF)
This can’t be a coincidence, can it? In fact, looking at other objects in Process Explorer, and comparing the reference count with WinDBG shows a similar pattern – not only are the numbers huge, but Process Explorer is always off by 0x7FFF. I also noticed a second pattern – the more handles that the object had, the bigger the reference count was, and always by a factor of around, or almost, 32767. In this case, dividing 458584 references by 14 handle counts gives us 32756 references-per-handle – close enough. Doing the opposite math on 491351 references gives us 14.995 handles.
Having worked on Process Explorer previously, I knew that as part of the code which handles the properties dialog and queries information on the object, the tool open its own handle to the object, temporarily creating 15 handles. Something became clear: there is now a bias in the reference count of objects, based on the number of handles. However, this bias is not exactly 32767, so something else must be going on.
Globally Searching for Opened Handles with Process Explorer
On a hunch, I decided to take a look at what would happen if I used Process Explorer’s “Find Handle or DLL” functionality, which searches all handles, system-wide, in order to find any which contain the name that the user entered. Because Windows only returns a list of PIDs and Handle Values, Process Explorer then has to attach to the process associated with the PID (since handles are local to each process) and then open the handle so that it can query its name. Let’s see what the search returned:

Fourteen processes have handles open to the DBWinMutex object. Let’s see what happened to the reference count…

The reference count went down to 491337. Which happens to be – wait for it – exactly 14 references less than what we had before. Repeating the exercise a few more times perfectly reproduces this behavior. Each time a new search is done, 14 processes are found (with 1 handle each), and the reference count goes down by 14 again.
The Per-Handle Reference Bias Revealed
At this point, we can infer the following two patterns:
- Each time a new handle is opened to an object, the reference count goes up by 0x7FFF, or 32767, on x64 Windows. On x86 Windows, the same behavior is seen by the way, but with 0x1F instead.
- Each time an existing handle to an object is used, the reference count goes down by 1.
The last part in this exercise was trying to understand where this data is coming from. The last bullet point above suggests that there is some sort of per-handle reference count, so I used the !handle extension in WinDBG to locate the handle entry for Explorer’s (PID 4440 as seen earlier) handle to DBWinMutex (handle 44 as seen earlier). I used flag 2 to request the object information as well. As you’ll see below, this gave me the pointer to the handle table entry, which I’ve highlighted in green. We can then use WinDBG’s symbol information to dump the entry using the dt command the _HANDLE_TABLE_ENTRY type inside the nt module.

As someone who has often dumped handle table entries in the debugger, the structure was striking to me, as it was very different from anything I had seen before. In fact, handle table entries only really stored two things before – the pointer to the object, and the granted access mask to the object. Yes, a few flags were used, but definitely nothing like we see above in Windows 8.1.
The New Handle Table Entry Format
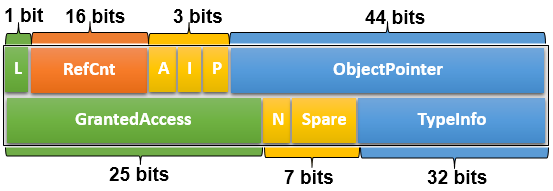
Here’s the big changes from previous versions of Windows, on x64:

- Instead of storing the full 64-bit pointer to the object header, Windows now only stores a 44 bit pointer. The bottom four bits are inferred to be all zeroes as all 64-bit allocations, code, and stack locations are 16-byte aligned, while the top sixteen bits are inferred to be all ones, as architecturally defined by the amd64 achitecture per the rules of canonical addresses (there must now be a dozen algorithms in Windows which rely on these bits having pre-defined, unchanging values!).
- Three of the assumed bits are re-used to store the three handle attributes (inherited, audited, protected), while a fourth is used to store the lock bit for the handle entry.
- Finally, the remaining 16-bits are now used to store an inverted reference count which keeps track of the amount of times that a handle has been used by a process. This reference count begins at 0x7FFF and counts down to zero for each additional reference made on the handle. The reference count (i.e.: the pointer count field in the object header) is biased by the number of inverted reference counts in each handle to the process.
- Because the access mask is only 25 bits if you ignore the generic access rights (which are always translated into specific rights), additional bits can be used for flags. One such bit is used, the others are spare.
- This leaves an unused 32-bit value that was wasted for alignment purposes on earlier versions of Windows. In Windows 8.1, this is now used to store the TypeInfo field, which is the Object Type Index in the Object Type Index Table (nt!ObTypeIndexTable). Dereferencing this index quickly reveals the object type for this handle, without having to even look at the object header.
On x86 Windows, the structure is different, but the changes semantically similar:

- No assumptions can be made on the top bits, so the entry continues to store a pointer to the object header, in which the bottom 3 bits are re-used to store the lock bit and 2 of the handle attributes (inherited, audited) as all x86 allocations are 8 byte aligned.
- Because the granted access mask is only 25 bits, the remaining 7 bits can now be used to store the missing attribute flag (protected), leaving 6 bits to store the reference count. As such, the reference count starts at 0x1F instead, on x86 systems.
- There is no additional space lost due to alignment, so there is no space to store the TypeInfo field.
Conclusion
As you can see, Windows 8.1 not only introduces a major rewrite to the handle table entry format but also makes these seemingly internal data structure changes to have a visible side effect when using the Windows Debugger or other tools to analyze reference counts on objects, something which driver developers often have to do (and even support professionals when troubleshooting leaks).
Additionally, for forensic analysts, the fact that there is now a per-handle “reference count”, which Microsoft should’ve really called an inverted access count, allows one to get a very detailed understanding of the number of times a handle has been used (and thus perhaps glean insight into unusual uses of the handle).
On a final note, this is a really good example of the type of Windows Internals analysis that one can do without doing any actual “black room” reverse engineering – I didn’t have to open IDA a single time or look at a single line of assembly code to discover and understand this functionality. By merely interacting with the system, deducing logic, and looking at state changes, the behavior became clear. If you ever note any other interesting Windows functionality or behavior that you’ve never been able to explain, feel free to leave a comment!
